The Consumer Products Safety Commission (CPSC) is the government organization that analyzes injury data caused by sports. The CPSC gets its data by checking emergency room information from selected hospitals around the country, then estimates national figures.
There are many statistics from the CPSC about skating injuries and we present some of these below. However, what is really useful is to compare the rate of skating injuries with injuries from other sports. In 2001 the New York Times did exactly this type of analysis using the CPSC’s 1999 data.
The New York Times found the following rates of severe injuries (ie requiring hospitalization):
| Sports | Injury Rate per 1000 Participants |
| Basketball | 8.8 |
| Soccer | 8.6 |
| Softball | 8.0 |
| Bicycling | 4.1 |
| Inline Skating | 3.4 |
| Tennis | 2.6 |
| Golf | 1.2 |
| Swimming | 0.7 |
As was shown, the rate of serious injury for inline skaters is less than half the rate for those playing active team sports such as basketball, soccer, and softball. Moreover, the injury rate for skaters is less than for bicyclists. Clearly, inline skating is not so dangerous as many people imagine.
Why is that? We can conjecture there are three reasons. First, inline skating injuries that do occur are usually minor scrapes and “road rashes”. Second, many inline skaters realize they are at some risk and wear proper protective gear. Third, many skaters probably do start out with a lesson, which significantly increases stopping ability and thus injury rate.
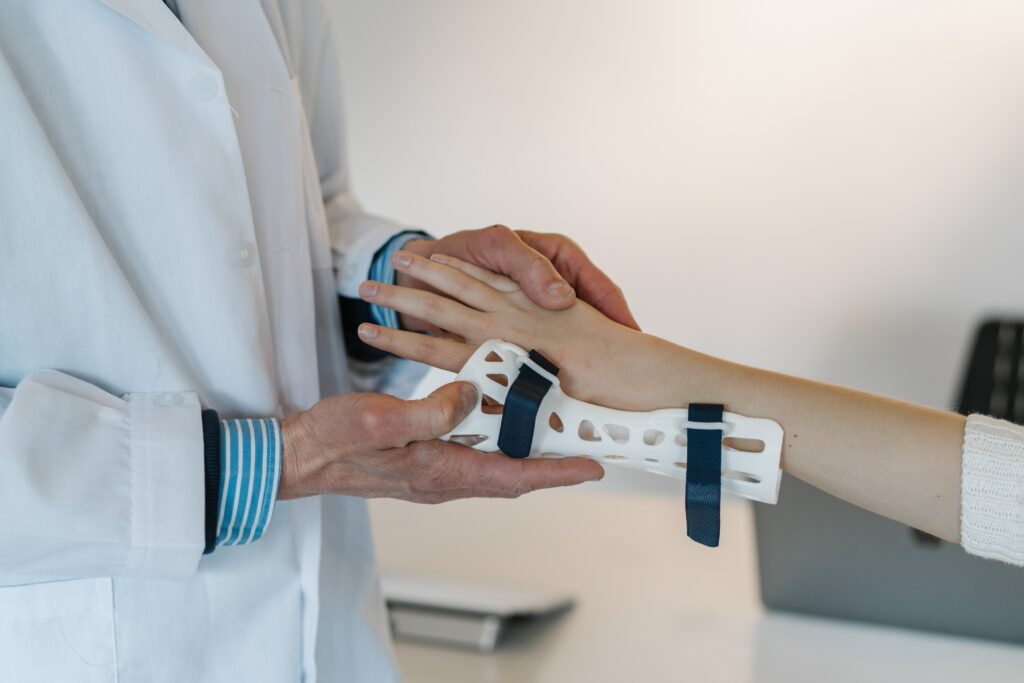
What can inline skaters do to reduce the possibility of a significant injury? Take a lesson and wear full protective gear. In fact, the Consumer Product Safety Commission estimates that up to 1/3 of serious skating injuries could be eliminated by wearing wrist guards alone! As will be seen in the statistics below, this is true not only for beginners but for intermediate and advanced skaters as well.
Other CPSC Statistics
1996 Percent of Total Injuries by Location
(alphabetized by body part)
| Ankle | 6.7% | Leg (lower) | 3.8 % |
| Arm (lower) | 13.5 % | Leg (upper) | 1.1 % |
| Arm (upper) | 0.7 % | Mouth | 1.2 % |
| Elbow | 7.6 % | Neck | 0.8 % |
| Eyeball | 0,2 % | Pubic Region | 0.8 % |
| Face | 7.1 % | Shoulder | 4.2 % |
| Finger | 5.5 % | Toe | 0.2 % |
| Foot | 1.0 % | Torso (lower) | 5.1 % |
| Hand | 3.6 % | Torso (upper) | 1.8 % |
| Head | 4.1 % | Wrist | 24.2 % |
| Knee | 6.8 % | Other | 0.5 % |
Note: As can be seen from the above chart, wrist injuries are by far the most common skating injuries. Wearing wrist guards prevents this because it allows the wrist to slide along the pavement rather than absorbing all the shock of a fall directly.
Characteristics of injured inline skaters
| Characteristic | % of Sample | |
| Ability Level | ||
| Novice | 10 | |
| Beginner | 34 | |
| Intermediate | 37 | |
| Expert | 18 | |
| Number of Times Inline Skating | ||
| 1 – 5 | 25 | |
| 6 – 12 | 12 | |
| 13 – 99 | 26 | |
| > 100 | 37 | |
| Reasons for Participation | ||
| To get exercise | 75 | |
| To play roller hockey | 37 | |
| For transportation | 35 | |
| To perform tricks (aggressive) | 31 | |
| Number of Lessons Taken | ||
| 0 | 50 | |
| 1 – 5 | 37 | |
| > 6 | 11 | |
| Ownership of Skates | ||
| Owned | 72 | |
| Rented or borrowed | 28 | |
| Condition of Skates | ||
| Good | 85 | |
| Fair or poor | 14 |
Note: 55% of injured skaters in this survey classified themselves as Intermediate or Advanced. Plus, 63% of the injured people could be classified as frequent skaters. The myth that only beginners will fall and get hurt is only that – a myth. Finally, note that only 48% of injured skaters had ever taken a lesson, even though stopping using the heel brake and falling properly using wrist guards are not natural motions. Take a lesson!
Characteristics of Falls and Injuries sustained by inline skaters
| Characteristic | % of Sample | |
| Location of Fall | ||
| Sidewalk or driveway | 26 | |
| Street | 22 | |
| Park or bike path | 19 | |
| Indoors | 10 | |
| Parking lot | 9 | |
| Other | 14 | |
| Proximate Cause of Fall | ||
| Spontaneous loss of balance | 41 | |
| Striking a stationary hazard 1 | 40 | |
| Striking a moving object 2 | 11 | |
| Swerving to avoid hazard or collision | 4 | |
| Other | 4 | |
| Special Factors Pertaining to Fall 3 | ||
| Hazardous Road Condition | ||
| Cited | 53 | |
| Cited as key cause | 63 | |
| Skating out of control | ||
| Cited | 25 | |
| Cited as key cause | 67 | |
| Poor visibility (twilight or darkness) | ||
| Cited | 17 | |
| Cited as key cause | 6 | |
| Fatigue | ||
| Cited | 11 | |
| Cited as key cause | 37 | |
| Anatomical Site of Primary Injury 4 | ||
| Wrist | 32 | |
| Lower leg (including ankle) | 13 | |
| Face (or chin) | 12 | |
| Elbow | 9 | |
| Knee | 6 | |
| Head | 5 | |
| Other | 23 | |
| Type of Injury | ||
| Wrist fracture | 25 | |
| Face or chin laceration | 10 | |
| Wrist sprain | 6 | |
| Elbow fracture | 5 | |
| Lower-leg fracture | 5 | |
| Ankle sprain | 4 | |
| Severity of Injury | ||
| Major | 51 | |
| Minor | 49 | |
| Safety Gear Worn at Time of Injury | ||
| Wrist guards | 33 | |
| Elbow pads | 28 | |
| Knee pads | 45 | |
| Helmet | 20 | |
| All of the above gear | 7 | |
| No gear | 46 |
Footnotes:
1. The hazard was usually a defect or debris in the road.
2. Collisions usually occurred with another skater, and less than one percent involved a motor vehicle.
3. More than one response was allowed. Percentages given for key-cause citations are of those who cited the factor.
4. Thirteen percent of skaters had more than one injury.
5. Seventy-two percent of wrist injuries, 48 percent of elbow injuries, 38 percent of head injuries, and 34 percent of knee injuries were major. Six percent of patients with major injuries were admitted to the hospital.
Note: Perhaps most interesting in the above statistics is that most injuries occurred from a “spontaneous loss of balance” (we all know what that means) or “striking a stationary hazard” (tripping over something). It is also interesting to note that while most skaters wear no gear, the most common kind of safety gear are knee pads, despite the fact that wrist injuries are much more common than knee injuries.
Anson
My name is Anson Nakamura and I have been inline skating for fun for 18 years. My friends and I skate at our local skate park and we just love to skate. I have been a big fan of the sport since I was a little kid. I started with a pair of Rollerblades that I got from a garage sale. I was terrible at first, but I kept at it and eventually I got pretty good. Now, I can do all sorts of tricks and I love skating more than ever. There's nothing quite like the feeling of cruising around on your skates, wind in your hair. f you've never tried skating, I urge you to give it a go. It's an incredible feeling and you might just get hooked like I did.